
If you’re in Capital Markets technology, you’ll know measuring Direct Market Access (DMA) latency is not as straightforward as it sounds. The goal is to measure latency from when a client (or trader) submits an order to when the order leaves the DMA infrastructure on its way to the venue.
Notwithstanding the different protocols in use, the main challenge is how to correctly correlate order messages at both endpoints. Orders flowing through broker infrastructure/servers arrive with one set of identifiers (client-side) and leave with another (venue-side), thus making it difficult to correlate the inbound client order to the outbound venue order to measure the “DMA hop” latency.
Over the past few months, I've helped a few clients work through exactly this challenge, and in each case the solution came down to a technique I want to walk you through: Corvil Analytics’ PNQM (Passive Network Quality Monitoring) two-stage translation.
Why DMA Latency Is Hard to Measure
The core problem is how to use the additional messages (on the wire) to correlate the client-side and venue-side orders.
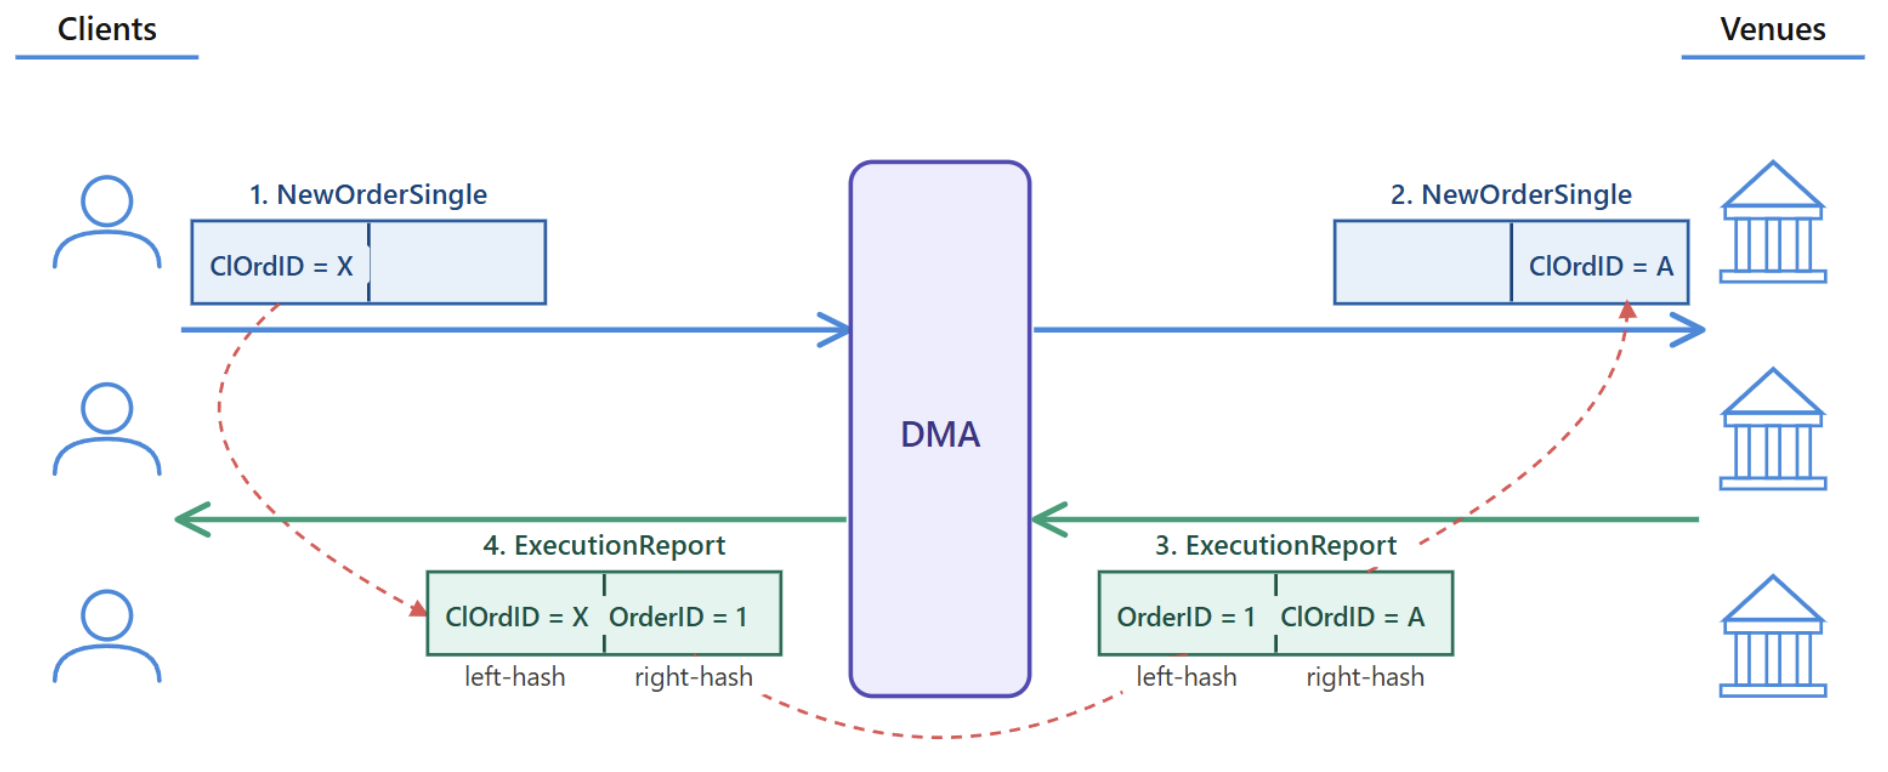
For example, A client sends a NewOrderSingle message (ClOrdID=X). The broker processes the order and sends its own NewOrderSingle to the venue with a completely different identifier (ClOrdID=A). There is not enough information in the two orders to correlate the correct messages.
To facilitate correlation, the response message (ExecutionReport) from the venue does contain a public OrderID (and sometimes a public ExecutionID). If these fields are passed on to the clients, then there is enough linkage information to correlate the two endpoint order messages.
Corvil's PNQM technology lets you exploit this to build a correlation path across the four messages:
Message #1: Client -> Broker: NewOrderSingle (ClOrdID=X)
Message #2: Broker -> Venue: NewOrderSingle (ClOrdID=A)
Message #3: Venue -> Broker: ExecutionReport (ClOrdID=A, OrderID=1)
Message #4: Broker -> Client: ExecutionReport (ClOrdID=X, OrderID=1)
We want to measure DMA latency between messages #1 and #2 – These are the PNQM signature endpoints. We can’t correlate directly, so we’ll use the ExecutionReport messages (#3 and #4) to make the linkage work using PNQM two-stage translation.
The daisy-chaining logic looks something like this:
Need to measure latency between client-side order (X) and venue-side order (A). Build custom-pnqm-signature for the two endpoints. As correlation cannot be achieved directly between the two messages, the custom-pnqm-signature signature-rule blocks need to use translation-hash commands.
From the client-side order, use the ClOrdID=X to find the related client-side ExecutionReport (ClOrdID=X).
From the above client-side ExecutionReport, take the OrderID=1 to find the venue-side ExecutionReport (OrderID=1).
From the above venue-side ExecutionReport (OrderID=1, identify ClOrdID=A and find the venue-side order (ClOrdID=A).
Understanding Left-Hash and Right-Hash
The concept that trips most people up when first configuring PNQM two-stage translation is the left-hash and right-hash within each translation rule, and how it links to the PNQM signature endpoints.
Left-hash — the identifier field Corvil will look up in the translation message. It's the key you already know.
Right-hash — the identifier field Corvil will extract from the same message and use as a lookup for the next message.
In our DMA example, the left-hash and right-hash commands apply to the client- and venue-side ExecutionReport messages. These act as the “joining” messages to make the latency measurement between the client-side and venue-side orders.
In a PNQM two-stage translation:
Client orders: PNQM signature (client-side) ClOrdID=X is matched to translation-stage-1 message (left-hash).
Client ExecutionReports: In translation-stage-1, from ClOrdID=X (left-hash) message, OrderID=1 is used (right-hash) is used as a lookup for translation-stage-2 left-hash (OrderID).
Venue ExecutionReports: In translation-stage-2, from OrderID=1 (left-hash) message, ClOrdID=A is used (right-hash) as lookup to PNQM signature (venue-side) message (ClOrdID=A).
There’s a detailed AppNote called “Monitoring DMA Latency” that walks through the steps needed to build a PNQM two-stage translation. It’s available for download from the Pico Support Portal.
It is a clean, well-structured guide and I'd recommend bookmarking it if you're regularly working with DMA configurations. The CLI snippets map directly onto what you'll type into the CNE, and the worked example with real ClOrdID and OrderID values in the Event Inspection screenshot is particularly helpful when you need to verify a configuration is working as expected.
As always, if you'd like a hand working through your specific configuration, feel free to reach out to your friendly neighborhood Corvil Analytics SE for assistance. This is exactly the kind of problem where a focused 60-minute session with someone who has done it before can save hours of trial and error.
Multiple Clients | Similar Use Cases -> One Solution
The reason I'm writing this now is that I've recently used the AppNote as the basis for hands-on config sessions with multiple clients, and the pattern of what tripped them up was similar enough to be worth sharing.
In both cases, the clients (brokers) had already set up their client and venue sessions and were monitoring Order-to-Ack latencies. The challenge was extending that to measure the broker's internal processing time – the DMA latency itself. The AppNote was a great foundation for the conversation. Once we were able to identify the messages of interest, the CLI configuration followed naturally. That said, getting the translation stages right on the first attempt is rarely guaranteed.
This leads me to the one tool that I find invaluable in troubleshooting any PQNM configuration, including DMA two-stage translations via Correlation Assistant.
Correlation Assistant – Is PNQM Working as Expected?
If you haven't used Correlation Assistant yet, now is the time. It is one of the most practical tools in the Corvil Analytics platform for anyone building or troubleshooting PNQM configurations.
For a couple of clients, I found the initial config was close but not quite working — latency measurements weren't appearing, or only a fraction of orders were being correlated.
Correlation Assistant quickly identifies which part of the config to focus on for troubleshooting. Note: Don’t forget to regularly clear the session counters so you can see the impact of your config changes.
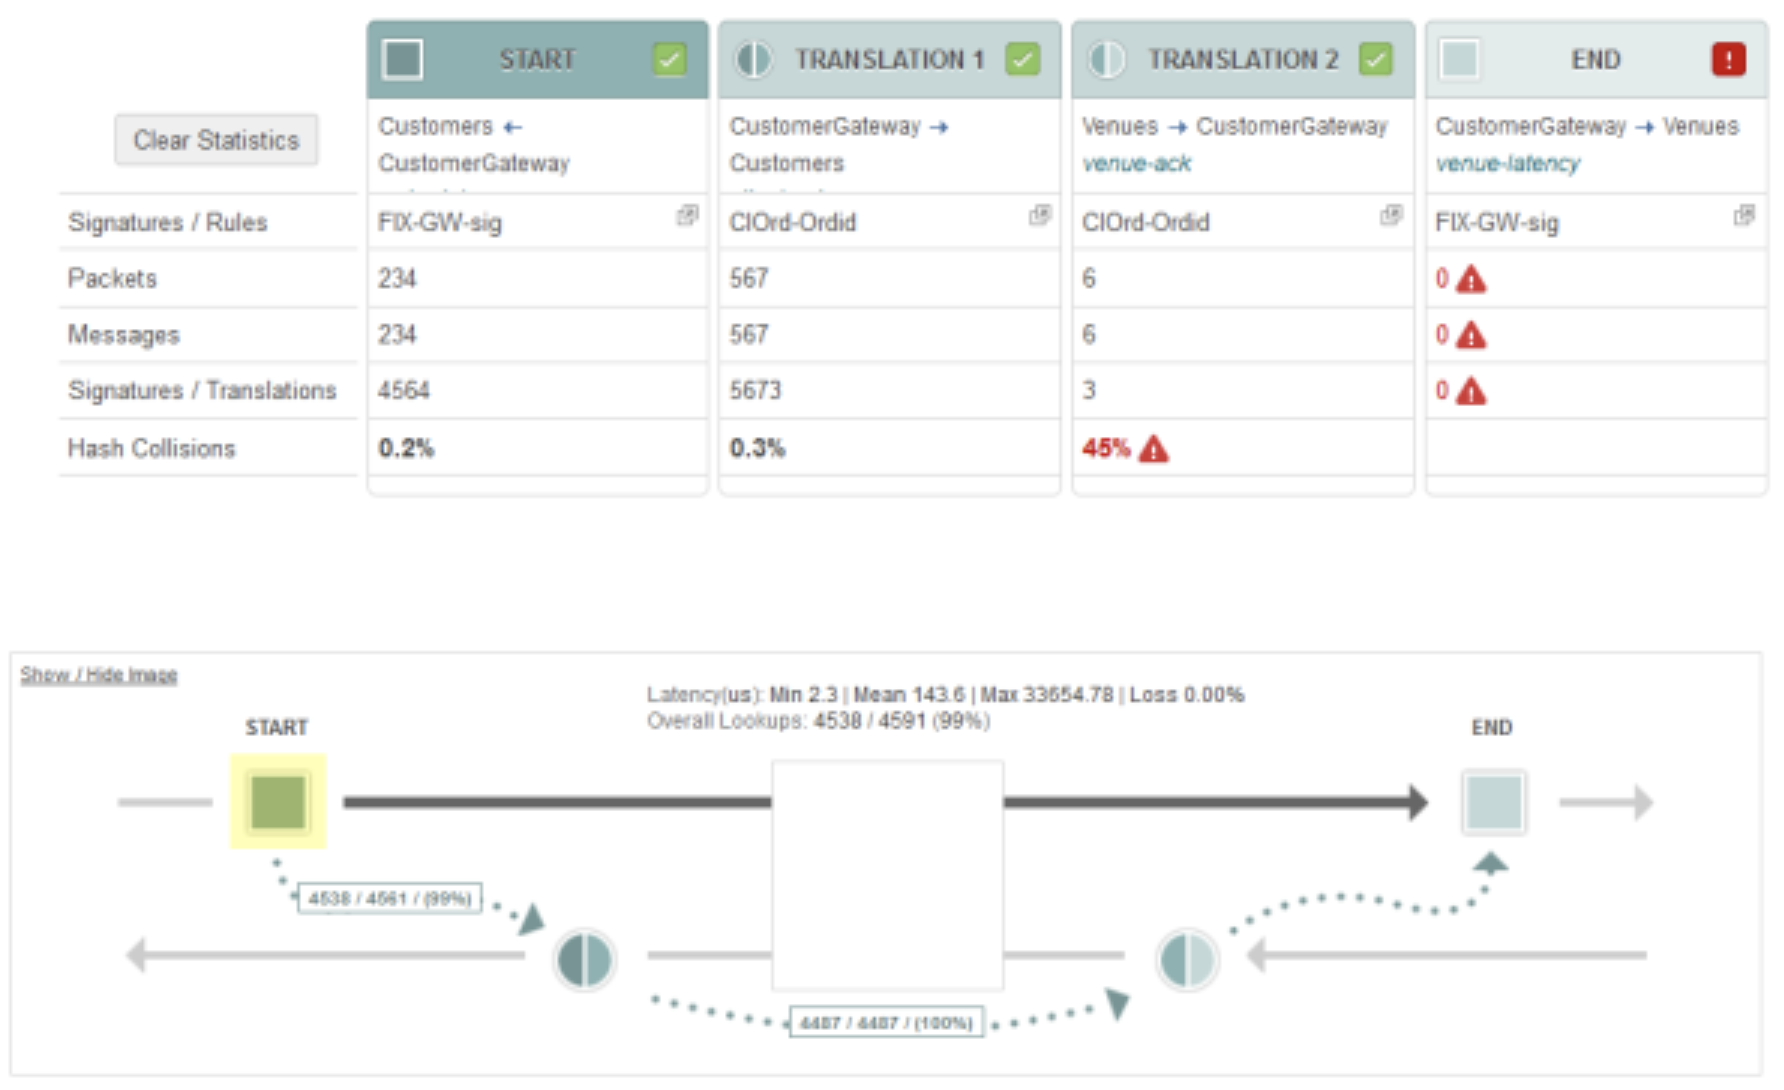
The Correlation Assistant is invaluable for a few key reasons:
It shows you if your config is seeing the correct traffic (packets & messages) at each stage of PNQM. Always look for the red triangles!
Provides visualization of the translation chain, so you can confirm PNQM signatures are being generated at the endpoints and at each translation stage.
Confirms if the translation logic is working as expected – Look for lookup count/percentages.
It points you toward a likely fix. In one of my recent client cases, the issue turned out to be a session direction. The subnet groups were incorrectly set to the wrong side for unidirectional sessions, so the translation messages were never being seen. The Correlation Assistant flagged zero signatures, which led us straight to the misconfigured session.
It gives you confidence when things are working correctly. Use Inspect Data/Event Inspection to show messages used for correlation and translation.
My advice: Don't wait until something breaks to open the Correlation Assistant. Use it proactively as you build out the configuration — it turns what could be a lengthy debugging exercise into a much faster iterative process.
Final Piece of Advice
If you want to set up DMA latency measurement in your environment, here's the steps I recommend:
Start with the "Monitoring DMA Latency" AppNote before writing any config. The four-step structure is logical, and the worked example prevents most common mistakes. I’ve been using Corvil for 15 years, and I still use it regularly!
Manually work through the PNQM correlations via Inspect Data / Event Inspection to check if correlations are feasible.
When in build mode, always enable trace-events for all sessions. This gives you visibility into all messages if you need to troubleshoot.
Use Correlation Assistant to see if PNQM is behaving as expected. Let it tell you what's working and what isn't!
Reach out to your Corvil Analytics SE or contact us. We are happy to assist you in "Having fun with PNQM two-stage translation".