I worked recently with a client team who was troubleshooting a critical application, which had seen a significant uptick in user complaints. They were pretty sure it was caused by a recent migration of some of the components to a cloud service, as the rise in user complaints started soon after the production instances of some shared database services were moved. However it was difficult for them to identify exactly what was going on and why: logs from all the relevant servers and database engines showed nothing untoward happening on those elements in their new nebulous home. In contrast, the application servers were logging sporadic transaction timeouts, but without enough detail to pinpoint which service might be at fault. In short, this was your typical IT Ops nightmare.
Troubleshooting
Since the application servers had not moved, we focussed our attention on the network paths connecting them to the cloud. These were in an area of the infrastructure which this client had not yet instrumented with Corvil appliances, and so there was no immediate way for them to get a good look at the network to see what might be going on. Luckily, the team with whom we were working had sufficient administrator privileges to deploy Corvil Sensor on the cloud-based database servers. (Corvil Sensor is a lightweight agent for capturing network flows of interest and forwarding them to a Corvil appliance for full analysis). With the darkness lifted, we were able to start troubleshooting in earnest.
It was interesting to see how our clients initially approached the problem: an experienced network operations engineer on the team, following his instincts, went straight for the raw packets. He used our GUI to extract a packet capture and fired it up in Wireshark. (This is the excellent open-source tool that is the first port of call that most network engineers turn to when faced with a packet capture.) This engineer's first challenge was to make sense of the tens of thousands of packets in the capture and he focused his attention by searching for a specific database transaction we knew had timed out. Using a "frame contains ..." filter, he was able to pinpoint the packet carrying an ID we knew was unique to this transaction, but nothing particularly unusual about the packet jumped out. Removing the filter and looking at the broader context, we saw there were some out-of-sequence packets just before this packet, which were retransmitted some time later - a hint that network loss might be playing a role, but nothing definitive.
Minutiae of Wireshark
At the suggestion of one of my colleagues, we enabled the PGSQL Wireshark dissector - the plugin that can decode the wire protocol that the PostrgreSQL database uses to communicate over the network. This annotated many packets with a somewhat cryptic message "TCP segment of a reassembled PDU", including the original packet containing the ID with which we started our investigation. This was not a message with which the network operations engineer had really dealt before, and a little Googling showed that it's a popular question on technical forums. We've captured our own articulation of the answer here.
The short version is that this message highlights that the packets contain application data that, because other packets were dropped or reordered, are not yet available to be delivered to the receiving application.
This information is key to diagnosing the problem: packet loss at the network layer leads to stalls in the TCP stack delivering application data, which in turn leads to the application timeout. The full chain of inference is difficult to make from the packet-data alone and requires in-depth knowledge about both TCP stacks and the application. In particular, it's very difficult to discern from just looking at TCP packets - it's like trying to view the picture on a vase that has been dropped on the floor and shattered into fragments.
Diagnosis and resolution
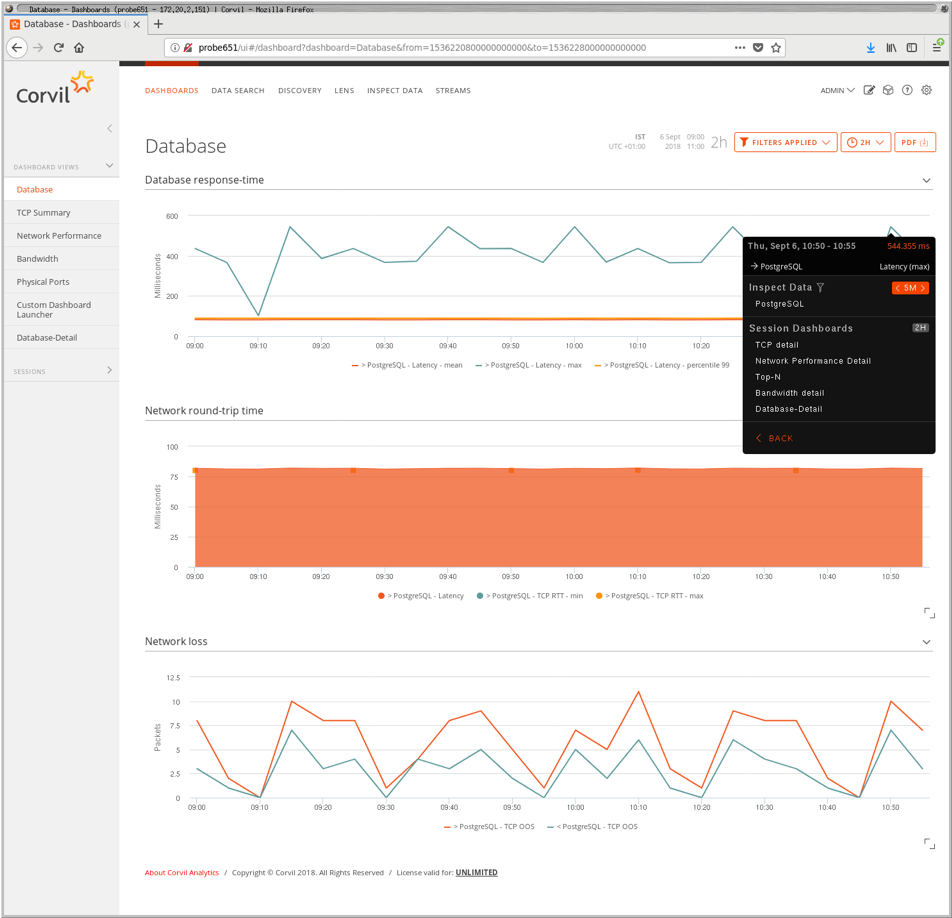
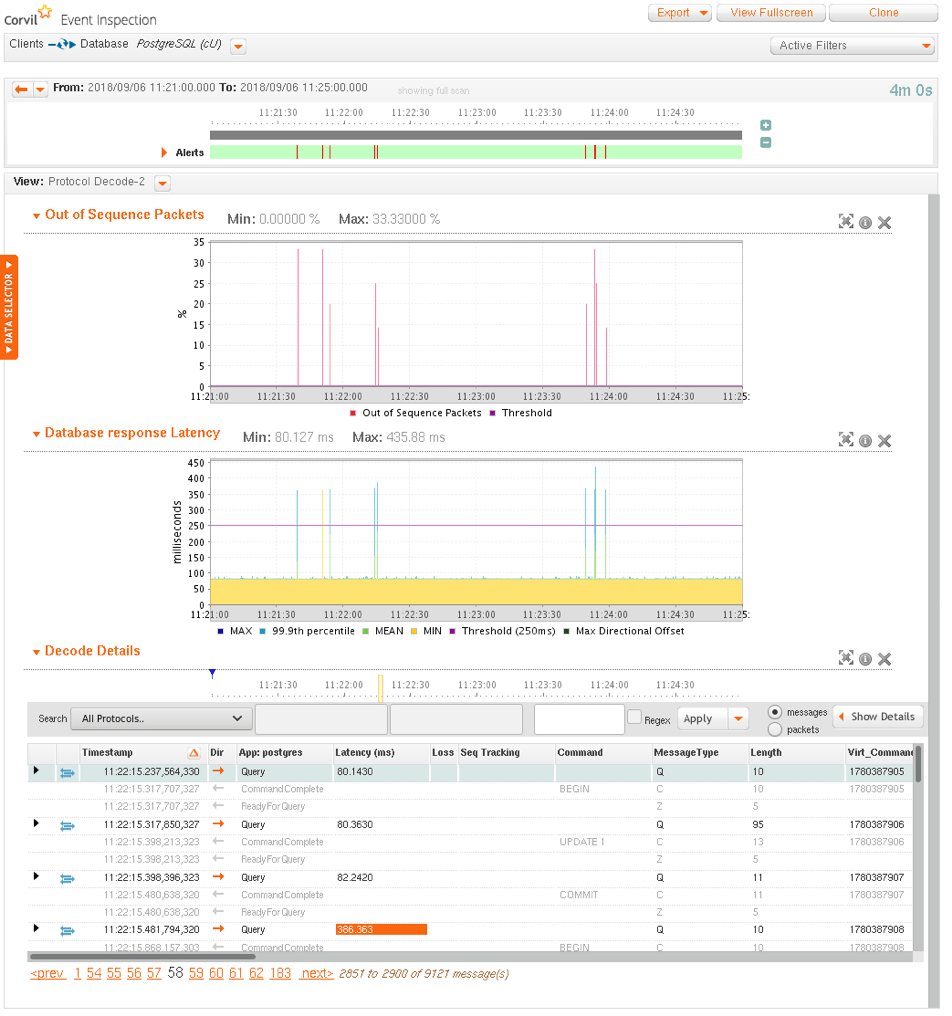
After this detour into their traditional workflow, we were able to guide our client's operations team through a next-generation workflow enabled by Corvil Analytics: with protocol discovery enabled, the appliance automatically detected the PostgreSQL traffic on the network, started reassembling the TCP streams and extracting the SQL transactions, and automatically reporting on transaction types and response times. Dashboards showing a simultaneous view of transaction performance and network transport quality allowed us to immediately identify that all instances of large response times were associated with packet-loss events on the network.

Figure 1. Database performance dashboard showing transaction response times, network round-trip times, and network packet loss. A single click on spikes in database response-times launches Event Inspection, as shown in Figure 2.

Figure 2. Forensic analysis of database performance, highlighting that network loss, leading to TCP out-of-sequence events, correlates exactly with the sporadic database response-time spikes. The table shows the details of the Postgres protocol messages suffering excessive response-time.
This was particularly compelling for our client: they didn't need to manually troubleshoot multiple application timeouts, each with a separate packet-capture, and painstakingly assemble the picture the evidence revealed. Instead, it was painted automatically for them across all their migrated database instances.
This analysis allowed them to take two actions: firstly, they raised a ticket with their network service provider with the concrete evidence of network loss. Secondly they were also able to notice that, while the database transactions were far slower than normal, they were completing successfully. As a workaround while the ticket was pending with their network provider, they were able to recommend to the application owners a temporary increase in the database timers. Although the application was a little less responsive than normal, this eliminated the bulk of the user complaints. By their own estimation, it would have taken their traditional approach at least several days to wrestle this problem under control. With the ease of deployment of Sensor, and the automatic analysis provided by Corvil, it took them a couple of hours to solve it, a more than 80% reduction in time.
Summary
TCP reassembly is an essential step to recovering the application picture, and Corvil software goes well beyond what Wireshark is capable of by providing:
- a comprehensive view of all transactions as experienced by the applications
- uncluttered by packetisation details, but fully integrated with network visibility
and, most importantly for operations teams,
- continuously in real-time and at scale
- across the full breadth of enterprise infrastructure, whether in data centers, branch offices, or the cloud.
In summary, network data can be complex and highly challenging to deal with but, when harnessed correctly is an enormously rich and rewarding source of operational insight into your IT, how users are experiencing services, and even commercially relevant metrics to improve business performance.

