

In high-speed trading environments, some questions about performance and trading outcomes can only be answered using detailed, accurate data about trading messages. When exactly did we send a particular order out to an exchange? What response did we receive, and when? Did we send our client an updated quote before or after we received their order? Did we try to cancel our exchange order before or after it traded?
Questions such as these require a high level of precision to answer definitively. They are best answered using timestamped message data, a type of data that we call machine-time data, rather than data relating only to orders and trades. Machine-time data consists of the underlying messages sent between trading parties in order to place, acknowledge, update and cancel orders and quotes, and to confirm trades. It includes accurate timestamps for every message sent or received. Unlike order data, machine-time data shows the sequence of actions that systems took leading to a particular outcome. It captures actions that failed or were rejected, as well as those that were successful, and the sequence in which they occurred. This level of detail can be crucial to fully understand why and how systems produce the results they do.
For example, you may be concerned about whether your quotes placed at an exchange are being picked off by faster traders. If you habitually see trade executions occurring when you issue price updates, but happening before your updates are applied, it can be a sign that other traders are reacting more quickly to the same signals that you are. Accurately timestamped details of quote updates and trade executions in machine-time data have the precision needed to reveal tell-tale patterns such as this.
A further distinguishing characteristic of machine-time data is that it associates each message record with a precise location within the trading environment – namely, the location where the record and its timestamp were captured. Understanding location is important because messages are subject to delays and transformations as they travel between systems. These can change the apparent sequencing of events depending on where they are observed. For example, records made at a broker’s trading system might suggest that a client’s order was received in response to an outdated quote, whereas at the client's hand-off point it may be clear that their order arrived before any quote update was transmitted. Visibility into certain key locations, such as the points where messages are received from clients or forwarded to outside markets, helps to answer business questions relating to external trading activity. Access to data from internal locations additionally gives insight into many operational questions, such as where processing delays or faults are occurring.
Corvil CNEs generate machine-time data from the wire-copy of trading messages as they traverse network links. This is a non-intrusive method of capturing message data at strategic locations and allows for accurate hardware time-stamping of messages at the moment they are sent or received. CNEs publish the data they extract from the network via an open streaming API, making it available for storage and analysis in downstream systems, including Corvil’s Intelligence Hub platform. Figure 1 shows selected fields from examples of this data to illustrate some of the characteristics described above:
tier |
timestamp |
eventname |
symbol |
client |
clordid |
|---|---|---|---|---|---|
Client |
1564543011142471200 |
order |
GBP/JPY |
BGMN |
QGESKAAAAAXVFCPI |
Client |
1564543011146153000 |
accepted |
GBP/JPY |
BGMN |
QGESKAAAAAXVFCPI |
Client |
1564543146406580200 |
accepted |
EUR/USD |
FXBRK |
L1L2#9uILKhA9k+gCtZX6+RkSgA@1 |
Client |
1564544043023641000 |
order |
AUD/USD |
BGMN |
QGESKAAAAATBSCYH |
Client |
1564544958403939000 |
order |
EUR/USD |
BGMN |
QGESKAAAABLA0TKS |
Client |
1564551386485357000 |
accepted |
AUD/USD |
BGMN |
QGESKAAAAATBSAMP |
Client |
1564551471015584300 |
order |
AUD/USD |
BGMN |
QGESKAAAAATBSCYK |
Client |
1564551804671436300 |
accepted |
EUR/USD |
BGMN |
QGESKAAAABLAYBT4 |
Client |
1564551924086432300 |
filled |
EUR/USD |
METRO |
1757286534 |
Client |
1564553044731024100 |
order |
EUR/USD |
BGMN |
QGER0AAAABLALKRG |
Figure 1. Selected machine-time data fields from an FX trading environment.
Each record is labeled with a location (called ‘tier’ in this view) and a timestamp, showing respectively where and when the record was captured. In this example, the records come from client-facing network links in an FX trading environment. Also depicted in figure 1 are selected fields from the captured messages themselves, showing what is happening (new orders, order-acknowledgments, and trade notifications) and which client and order are involved. This is just a subset of the information that CNEs extract from the original wire-copy, but it is already enough to locate specific order updates, match those updates against records from other trading systems, and determine precisely when they were sent to or received from clients.
Corvil’s machine-time data architecture has several specific advantages for developing analytics that exploit message data. Firstly, it is a real-time data stream, with message records typically appearing within seconds of underlying events. This means that analytics can be performed intra-day instead of at T+1, providing live views into trading message activity as it happens. It also means that results can be used to generate real-time feedback into trading systems themselves, allowing behavior to be modified quickly when appropriate. Secondly, as those who already use CNEs will know, these devices generate extensive analytics on the network data that they see, as well as providing data for external analysis. In fact, many of the analytics that CNEs compute on-the-box - such as latency metrics and order life-cycle indicators - are included in the data that they stream out. These analytics could be computed externally from message details and timestamps, but their inclusion in the stream means that you don’t have to.
Perhaps the most important advantage of Corvil’s architecture is that it tackles one of the toughest challenges of message-data processing for you: the problem of data cleansing and formatting. Most trading firms operate across multiple external markets, each using their own message protocols and formats. In a large firm, additional protocols may be used to communicate between internal systems and with clients. Message-data records therefore inevitably come in many different shapes and sizes, with common actions and concepts (such as orders, trades, prices and quantities) represented in different ways. Message protocols also contain activity that is not relevant to most use cases, such as heartbeat exchanges and other low-level session management messaging. All of this means that practitioners who wish to cross-reference or aggregate data across different systems and markets must do a great deal of work to filter and consolidate record formats onto a common basis before they can begin addressing their main use case.
Corvil’s machine-time data solves this problem in two steps. CNEs use protocol-specific functionality to filter the data they extract from networks and to perform column-level normalization so that only relevant records are streamed, containing a common set of verbs and data fields regardless of the original protocol. All major trading protocols are supported. When Corvil Intelligence Hub is used as a destination for this data, it performs a second level of field-value normalization – ensuring for example that order-types and modifiers such as time-in-force are represented in exactly the same way across protocols. The end result is a cleansed data set providing a common representation of trade messaging activity, ready for immediate analysis.
Key Benefits of Corvil’s Machine-Time Data Streams
Shows the messages communicated between different trading parties and systems
Direct visibility into activity at key strategic locations such as client- and exchange hand-offs
Accurate, synchronized timestamps reveal the precise timing and sequencing of events
All order- and trade-related actions are covered, including those which fail or are rejected – orders, acknowledgments, updates cancels, quotes, trades, rejects
Includes key identifiers such as order and client IDs, allowing wire-level events to be tracked and matched to trading system records
Supports business-level metrics and analytics using data fields such as symbols, prices, and quantities
Provides a consolidated, normalized view into messaging activity across multiple markets and systems, regardless of underlying protocols
Real-time data for intraday visibility, analytics, and reaction - not T+1
Open streaming API with pre-built connectors for most data platforms
Example Use Case: Measuring the impact of stale quotes in FX trading
It’s not uncommon for FX brokers to honor client orders against quotes that have just gone out-of-date, recognizing that clients with slower systems may need a little time to ingest the latest updates. This raises the question though of exactly how much leeway can be offered without exposing the broker to potentially adverse trading?
In this example, we analyze the impact of stale quotes in Corvil’s Intelligence Hub using precision time-stamped message data captured at the client's hand-off point. Our set-up uses a Zeppelin notebook to execute queries and analytics in Spark Scala against machine-time data stored in Intelligence Hub’s Presto database.
In an FX setting, Intelligence Hub places its normalized message data in a table called "trading__fx__normalized_fx_raw". Our first step is to extract quotes and orders from this table.
%spark.spark
val quotes = sqlContext.sql("SELECT timestamp, quoteentryid, client, symbol, quotetype, price FROM trading__fx__normalized_fx_raw WHERE eventname in ('quote')")
val orders = sqlContext.sql("SELECT clordid, timestamp, client, symbol, side, orderqty, quoteentryid, currency, tier, session FROM trading__fx__normalized_fx_raw WHERE eventname in ('order')")
quotes.registerTempTable("quotes")
orders.registerTempTable("orders")
Joining these two datasets on the ‘quoteentryid’ field shows us which quote each order was placed against. We also match on client and side to disambiguate results:
%spark.spark
val actual_quotes = sqlContext.sql(
"""
SELECT orders.clordid,
         quotes.quoteentryid AS actual_quote_id,
         quotes.timestamp    AS actual_quote_timestamp,
         quotes.price        AS actual_quote_price
FROM orders
LEFT OUTER JOIN quotes ON (
                 orders.quoteentryid = quotes.quoteentryid
                 AND orders.client = quotes.client
                 AND ( (orders.side = 'Buy' AND quotes.quotetype = 'Offer') OR  (orders.side = 'Sell' AND quotes.quotetype = 'Bid') )
)
"""
).cache()
actual_quotes.registerTempTable("actual_quotes")
To reveal which quotes were out-of-date at the time the order was received, we locate the most recent relevant quote delivered prior to each order, availing of SQL’s window functions to find them:
%spark.spark
val expected_quotes = sqlContext.sql(
"""
SELECT orders.clordid,
         quotes.quoteentryid AS expected_quote_id,
         quotes.timestamp    AS expected_quote_timestamp,
         quotes.price        AS expected_quote_price,
         ROW_NUMBER() OVER (PARTITION BY clordid ORDER BY quotes.timestamp DESC) AS rn
FROM orders
LEFT OUTER JOIN quotes ON (
                 orders.client = quotes.client
                 AND orders.symbol = quotes.symbol
                 AND ( (orders.side = 'Buy' AND quotes.quotetype = 'Offer') OR (orders.side = 'Sell' AND quotes.quotetype 'Bid') )
                 AND orders.timestamp > quotes.timestamp
               )
HAVING rn = 1
"""
).drop($"rn").cache()
expected_quotes.registerTempTable("expected_quotes")
We can now easily find orders that cite quotes older than the most up-to-date quotes at the time...
%spark.spark
val quote_diffs = sqlContext.sql(
"""SELECT  actual_quotes.clordid, actual_quotes.sys_partition,
          expected_quote_price - actual_quote_price AS price_delta,
          expected_quote_timestamp - actual_quote_timestamp AS quote_delay,
          expected_quote_timestamp > actual_quote_timestamp AS is_quote_stale
FROM actual_quotes INNER JOIN expected_quotes
ON ( actual_quotes.clordid = expected_quotes.clordid )
"""
).cache()
quote_diffs.registerTempTable("quote_diffs")
... and review what delta in trading value they represent, and just how out-of-date they actually were:
%spark.sql
select timestamp,client,symbol,side,orderqty*price_delta as value,quote_delay from orders left outer join quote_diffs ON  (orders.clordid = quote_diffs.clordid) where is_quote_stale
timestamp |
client |
symbol |
side |
value_delta |
quote_delay |
|---|---|---|---|---|---|
1554182297434840791 |
BGMN |
EUR/USD |
Sell |
-1 |
24169001 |
1554183172429787813 |
BGMN |
USD/JPY |
Sell |
-600 |
99665999 |
1554183584411116819 |
FXBRK |
EUR/USD |
Buy |
69 |
30401001 |
1554181655233753823 |
BGMN |
USD/JPY |
Sell |
-1200 |
20282000 |
1554182989266126844 |
BGMN |
EUR/USD |
Sell |
0 |
3339118034 |
1554660895002804402 |
BGMN |
USD/JPY |
Sell |
-79 |
1558549919 |
Timestamps and delays in this table are measured in nanoseconds, values are measured in base currency units and represent an unfavorable delta for us (versus the most up-to-date quote) when they are negative for Sell orders or positive for Buy orders. We have found a handful of orders in our dataset placed against quotes that were out-of-date by amounts ranging from approx 20 milliseconds to several seconds and all but one of them traded unfavorably to us.
In this example, we have generated results by executing queries interactively against Intelligence Hub’s captured data. The platform also supports continuous query execution against incoming data as it arrives and includes a dashboard system for visualizing results. These tools make it easy to monitor the pattern of orders and executions on stale quotes over time (the top chart in figure 2 below), and the extent to which stale quote executions trade in the client’s favour (bottom chart).
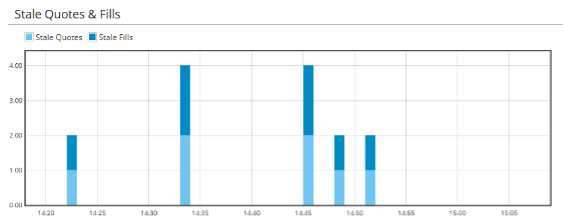
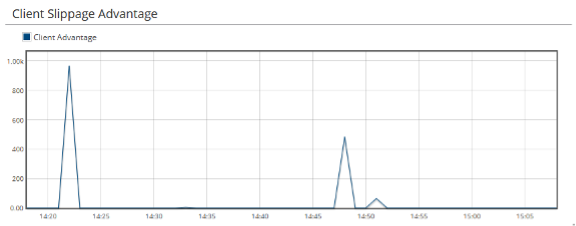
Figure 2. Stale quote slippage analytics derived from machine-time data. The top chart shows the number of orders and executions against stale quotes, and the bottom chart shows the extent to which the executions trade in the client’s favour.
Special Thanks:
Xiubo Zhang
Data Scientist, Pico